
Configure Calculated Insights - Visual Insights Builder
Configure Calculated Insights using Visual Insights Builder to generate meaningful business intelligence from Data Cloud.
Salesforce Data Cloud Developer
1. Abstract
Calculated Insights (CI) in Salesforce Data Cloud allow you to define and compute aggregated metrics directly on top of unified profile and transactional data stored within Data Cloud. Rather than relying on external tools or manual reporting, Calculated Insights enable you to derive meaningful measures — such as total lifetime spend, average order value, and transaction counts — at both the Individual and Unified Individual level, making these computed values available for use in segmentation, activation, and analytics workflows.
This exercise focuses on configuring a Spend By Customer calculated insight using the Visual Insights Builder, a no-code/low-code canvas interface that allows you to construct joins, aggregations, and filters visually without writing SQL directly. The insight aggregates sales data from the Sales Order data model object and connects it through the identity resolution bridge pattern (Individual → Unified Link Individual → Unified Individual) to associate transaction metrics with unified customer profiles.
The objective is to compute the following five measures at the Unified Individual level:
- Sum of Grand Total Amount (Lifetime Value)
- Average of Grand Total Amount (Average Purchase Value)
- Minimum of Grand Total Amount (Lowest Order Value)
- Maximum of Grand Total Amount (Highest Order Value)
- Count of all Sales Order transactions (Lifetime Transactions Count)
2. Solution
Approach Overview
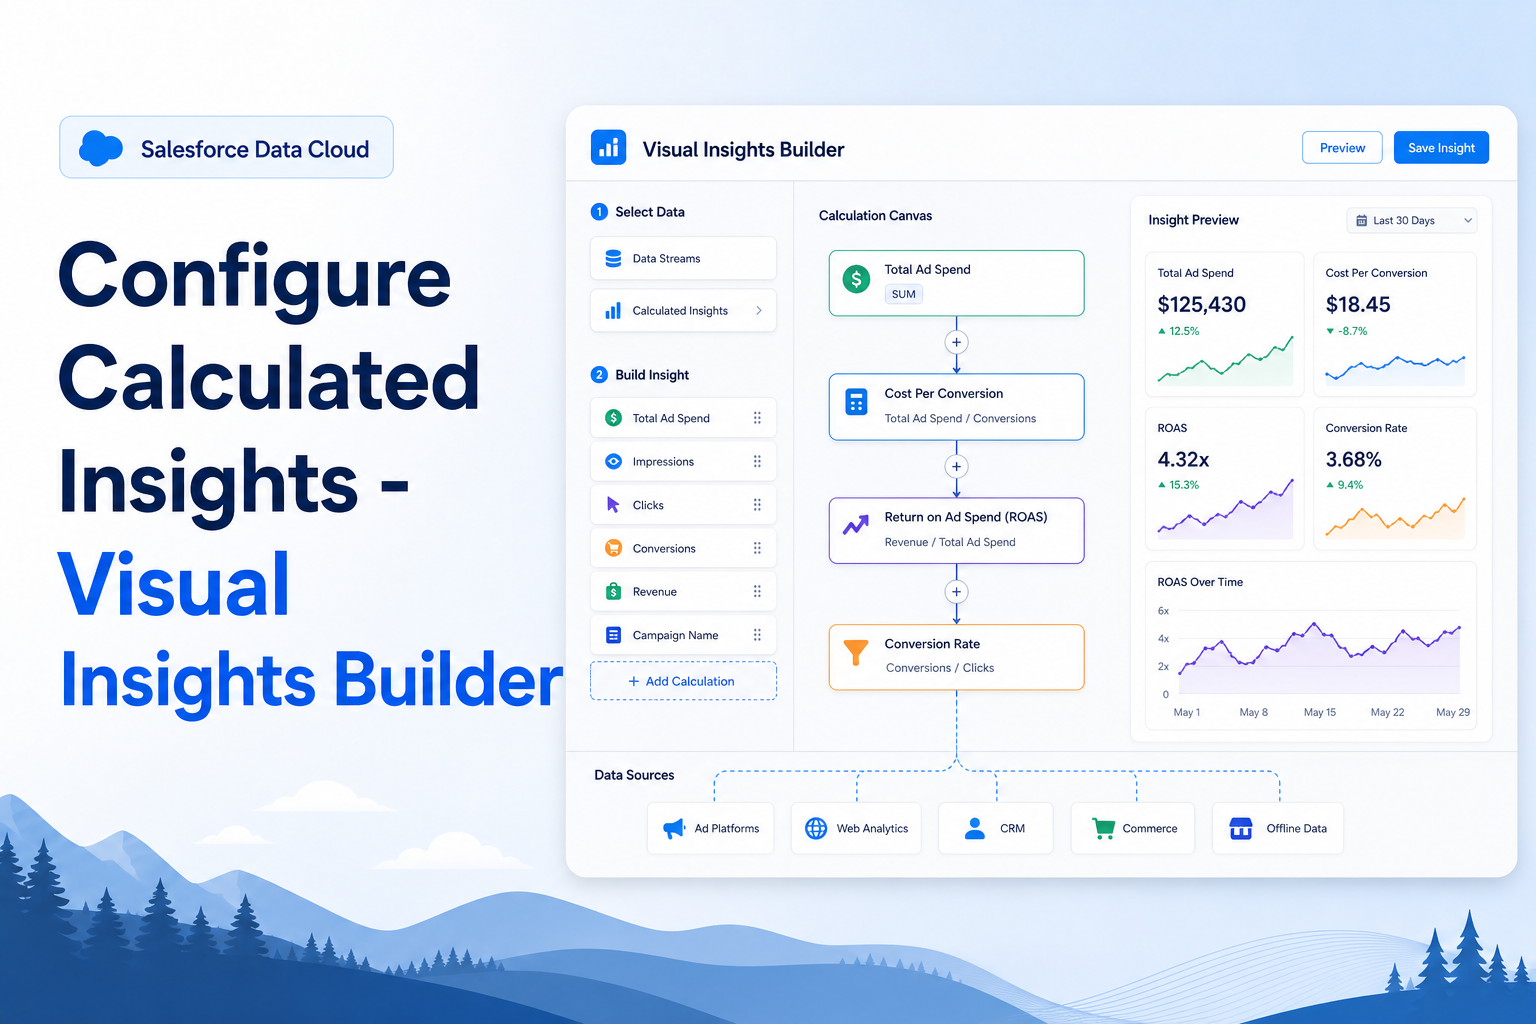
The Visual Insights Builder provides a drag-and-drop canvas where you construct a data pipeline made up of connected nodes: input data sources, join nodes, aggregate nodes, and filter nodes. Each node is configured independently and the canvas visually represents the flow of data from source through transformation to the final computed output.
For the Spend By Customer insight, the data pipeline is structured as follows:
Sales Order
   → Join to Individual
   → Join to Unified Link Individual
   → Join to Unified Individual
   → Aggregate
   → Filter
This join chain follows the same bridge object pattern established during Identity Resolution. Sales Order records are associated with Individual records through the Sold To Customer field. Individual records are then linked to Unified Link Individual (the bridge DMO), and from there to the Unified Individual. This ensures that all sales transactions are correctly rolled up to the unified customer level, regardless of which source system the original Individual record came from.
Why the Data Source Join Key Matters
When joining Individual to Unified Link Individual, a critical design decision is to include Individual.Data Source = Unified Link Individual.Data Source as an additional join key, alongside the Individual Id match. This is necessary to prevent a cross join scenario where duplicate Individual IDs from different data sources cause transaction counts to be inflated (overcounted). Without this additional constraint, a single Individual record could incorrectly match to multiple Unified Link Individual records from different sources, multiplying the aggregated values.
The preferred long-term approach for avoiding this is the Fully Qualified Keys feature in Data Cloud, which uses Key Qualifier fields to uniquely scope Individual IDs to their originating data source. However, since Key Qualifiers were not configured in the earlier data stream setup steps in this exercise series, the Data Source join key approach is used instead as a practical workaround.
Aggregation Design
The insight computes five measures, all sourced from the Sales Order object:
| Measure Name | Aggregation | Source Field |
|---|---|---|
| LifetimeValue | SUM | Grand Total Amount |
| AvgPurchaseValue | AVERAGE | Grand Total Amount |
| LowestOrderValue | MINIMUM | Grand Total Amount |
| HighestOrderValue | MAXIMUM | Grand Total Amount |
| LifetimeTransactionsCount | COUNT | Sales Order Id |
Two dimensions are included to group the aggregated results:
| Dimension Name | Source Field | Source Object |
|---|---|---|
| UnifiedID | Unified Individual Id | Unified Individual |
| CustomerID | Individual Id | Individual |
Filtering Logic
A filter is applied to restrict the aggregation to only meaningful, completed transactions. The filter criteria is:
Sales Order Status = CompletedThis ensures that cancelled, pending, or in-progress orders are excluded from the spend calculations, producing accurate lifetime value figures.
Output and Scheduling
The insight is saved with the name Spend By Customer Visual Builder and is not scheduled for automatic recurring runs in this exercise. After saving, it is manually triggered using the Publish Now option. Processing takes approximately 30–40 minutes as the platform schedules and executes the calculation job. Results can be verified in the Data Explorer tab once the Last Run Status shows as completed.
A fallback option exists: if the Visual Builder encounters an internal error during saving (a known occasional platform issue), the same insight can be deployed using the Create with SQL option, using the SQL generated by the Visual Builder as reference.
3. Step-by-Step Guide
Step 1 — Navigate to Calculated Insights and Begin
- Navigate to the Calculated Insights tab in Data Cloud
- Click Create and select the Create with Visual Builder option
- Confirm Calculated Insight in the dialog that appears
- Click the Get Started button to open the visual canvas
Step 2 — Add the Input Data Source
- On the canvas, locate and select Sales Order as your input data object
- This sets Sales Order as the root node of the data pipeline
Step 3 — Add and Configure the Join to Unified Individual
- Click the + icon next to the Sales Order node and add a Join node
- Select Unified Individual as the object to join to
- The system will automatically expand this into three join nodes, adding Individual, Unified Link Individual, and Unified Individual to the canvas simultaneously
Configure the Join to Unified Individual node:
- Click on the Join to Unified Individual node
- Update the name to: Join to Unified Individual
- Verify the following configuration:
- Join Type = INNER
- Join Key = Unified Link Individual.Unified Individual Id = Unified Individual.Unified Individual Id
- Click Apply to save
Step 4 — Configure the Join to Individual Node
- Click on the Join to Individual node
- Update the name to: Join to Individual
- Verify the following configuration:
- Join Type = INNER
- Join Key 1 = Sales Order.Sold To Customer = Individual.Individual Id
- Join Key 2 = Sales Order.Key Qualifier Sold To Customer = Individual.Key Qualifier Individual Id
- Click Apply to save
Step 5 — Configure the Join to Unified Link Individual Node
- Click on the Join to Unified Link Individual node
- Update the name to: Join to Unified Link Individual
- Verify the base join key:
- Join Type = INNER
- Join Key = Individual.Individual Id = Unified Link Individual.Individual Id
- Remove any automatically added join key on Key Qualifiers (since Key Qualifiers were not configured for the Individual DMO in this exercise)
- Add an additional join key:
Individual.Data Source = Unified Link Individual.Data Source
- Click Apply to save
Step 6 — Add and Configure the Aggregate Node
- Click the + icon next to the last join node on the canvas
- Add an Aggregate node
- Configure the following Measures:
- Sum of Grand Total Amount from Sales Order → name = LifetimeValue
- Average of Grand Total Amount from Sales Order → name = AvgPurchaseValue
- Minimum of Grand Total Amount from Sales Order → name = LowestOrderValue
- Maximum of Grand Total Amount from Sales Order → name = HighestOrderValue
- Count of Sales Order Id from Sales Order → name = LifetimeTransactionsCount
- Configure the following Dimensions:
- Unified Individual Id from Unified Individual → name = UnifiedID
- Individual Id from Individual → name = CustomerID
- Click Apply to save
Step 7 — Add and Configure the Filter Node
- Click the + icon on the canvas to add a Filters node
- Click the + button inside the Filters configuration panel to add a new criteria
- Configure the filter:
- Field = Sales Order Status
- Click Next
- Operator = equal
- Value = Completed
- Click Apply
- Click Apply again to save the full filter configuration and close the panel
The canvas should now show the complete pipeline: Sales Order → Join to Individual → Join to Unified Link Individual → Join to Unified Individual → Aggregate → Filter
Step 8 — Save and Run the Calculated Insight
- Click Save and Run
- Enter the following details:
- Name: Spend By Customer Visual Builder
- Description: Aggregated insights on customer spend from Sales Order data
- Schedule: Not Scheduled
- After saving, locate the dropdown on the right side of the screen
- Select Publish Now to initiate the processing job
- The Last Run Status will update to Pending, confirming the job has been queued
Step 9 — Monitor Processing and Verify Results
- Processing takes approximately 30–40 minutes for the platform to pick up and execute the calculation job
- Once complete, navigate to the Data Explorer tab
- Select the Calculated Insight output object corresponding to Spend By Customer Visual Builder
- Review the records to verify that the five measures (LifetimeValue, AvgPurchaseValue, LowestOrderValue, HighestOrderValue, LifetimeTransactionsCount) are populated correctly against Unified Individual Id and Individual Id dimension values
Step 10 — Fallback: Deploy via SQL (If Visual Builder Errors)
If the Visual Builder returns an "An Internal Error has occurred" message when saving, use the following alternative approach:
- Navigate back to Calculated Insights and choose Create with SQL option
- Use the SQL generated by the Visual Builder canvas (visible via the Inspect SQL option within the builder) as the basis for the SQL-based deployment
The SQL represents the same join chain and aggregation logic built visually, and deploying it via the SQL path bypasses the builder's saving issue without changing the underlying logic or output.
4. Conclusion
Summary
The Calculated Insights Visual Builder provides a structured, canvas-based approach to defining complex aggregation logic on top of Data Cloud's unified data model without requiring SQL expertise. By chaining join nodes from Sales Order through Individual, Unified Link Individual, and Unified Individual, the Spend By Customer insight correctly attributes transactional measures to unified customer profiles — respecting the bridge object pattern established during Identity Resolution.
The exercise produces five practical customer spend metrics (lifetime value, average purchase value, lowest and highest order values, and transaction count) that are directly usable in segmentation and activation workflows within Data Cloud. The filter on Sales Order Status = Completed ensures only legitimate, finalized transactions contribute to the aggregated values.
Pros
- No-code visual experience: The Visual Insights Builder allows data architects and admins to configure complex multi-object join logic and aggregations without writing SQL, significantly lowering the technical barrier for CI configuration
- Automatic join scaffolding: When joining to Unified Individual, the platform automatically inserts the intermediate Individual and Unified Link Individual nodes, reducing the risk of accidentally missing the bridge object pattern and producing incorrect results
- SQL transparency: The Visual Builder generates inspectable SQL in the background, allowing technical users to review and understand the exact query logic being executed — and to reuse it via the SQL path if needed
- Direct integration with segmentation: Once published, the computed measures (LifetimeValue, AvgPurchaseValue, etc.) are immediately available as attributes in the Segment Builder, enabling data-driven audience filtering without additional configuration steps
- Flexible scheduling: Insights can be set to run on a schedule or triggered manually via Publish Now, giving control over when computation costs are incurred
Cons
- Known internal error on save: The Visual Builder has a documented occasional failure where saving triggers an "An Internal Error has occurred" response. This requires falling back to the SQL deployment path, which partially undermines the no-code value proposition of the builder
- Processing time is significant: A 30–40 minute processing window per insight run makes iterative testing and debugging slow. A misconfigured join or filter requires waiting through a full job cycle to observe the impact of a correction
- Identity Resolution dependency is strict: CI configuration must wait for Identity Resolution to fully publish. Any attempt to configure or run insights before that completes will produce zero-count results in segmentation, with no obvious error to indicate the root cause — making this a common source of confusion during implementation
- Cross join risk requires careful join key management: The need to manually add the Data Source join key between Individual and Unified Link Individual to prevent overcounting is a non-obvious implementation detail. Missing it produces inflated metrics that may not be immediately detectable without data validation steps
- Key Qualifier complexity deferred: The recommended long-term solution (Fully Qualified Keys) is bypassed in this exercise due to earlier setup decisions. In production implementations, failing to configure Key Qualifiers properly and then building Calculated Insights on top of that gap can create difficult-to-diagnose data quality issues at scale